How to Make Viscosity Corrections for Centrifugal Pumps
Think again if you are pumping thick fluids using water pump performance curves.
Viscosity is a fundamental property of a liquid. It is a fluid’s resistance to flow and is higher for thicker fluids. For example, a fluid with high viscosity, such as maple syrup, is thicker and resists flow more when compared to a fluid with a lower viscosity, like water.
Typically, pump manufacturers use water to obtain the values for their pump performance curves, even if the intended service of the pump is for a fluid with properties that are different from water. But what happens when the fluid’s viscosity significantly deviates from water? This is where engineers need to adjust the pump performance curves to account for the difference in viscosity between water and the actual fluid in the pump.
Pump performance curves describe the head added to a fluid, pump power and net positive suction head required (NPSHr) at a variety of different volumetric flow rates. Due to the importance of centrifugal pump performance in every fluid industry, it is imperative that accurate corrections are used when a centrifugal pump uses a thicker fluid than what the pump manufacturer used to evaluate the performance. A more viscous fluid will generally experience a decrease in volumetric flow rate, head and efficiency compared to water at the same pump speed. Likewise, pump power and NPSHr increase as viscosity increases.
Pump manufacturers that only provide water performance curves for pumps should consider providing performance curves for thicker fluids. Engineers who have been correcting the water performance curves when pumping thicker fluids should consider using the American National Standards Institute/Hydraulic Institute (ANSI/HI) 9.6.7-2015 guidelines.
While it is preferred to use actual performance curve data from pump manufacturers for thicker fluids, ANSI/HI 9.6.7-2015 provides a commonly used guideline to correct pump performance based on viscosity. This guideline has an acceptable amount of uncertainty, but it is imperative to understand the uncertainties of this method to ensure its correct application in pumping systems. This article summarizes technical findings and discussion as to why the guideline is acceptable despite the uncertainties.
Viscosity corrections rely on empirical methods using test data to properly account for a pump performance when the service fluid has a different viscosity than the reference fluid, typically water. As with many empirical methods, uncertainty inevitably exists and falls into one of the following categories:
The use of a dimensionless number to characterize complex phenomenon
The limited data set used to create the empirical model
The reliability of data measurement equipment
Before going into more detail, it is worth discussing why performance decreases when pumping a viscous fluid.
Intuitively, a thicker fluid will experience increased hydraulic losses. An increased viscosity yields a decreased Reynolds number, which increases the friction factor and the losses. While the geometry of a pump impeller is different and more complex than that of a pipe, the same principle applies. Increased friction within the pump will decrease the amount of head the pump can provide. While this is just an estimation of the complex losses, the Reynolds number provides a proportional estimation.
A centrifugal pump converts rotational kinetic energy from the pump impeller into hydrodynamic energy of the fluid. Shear forces on the fluid between the rotating impeller and the stationary pump casing generate frictional resistance called disk friction. This frictional resistance is typically the primary cause of reduced pump efficiency during normal operation. Using the Reynolds number again, an increase in viscosity yields a larger Reynolds number and, thus, a larger resistance, which results in increased power consumption. Engineers can use the Reynolds number paired with the specific speed of the pump to estimate the disk friction. Disk friction is a complex interaction; so again, estimating these effects with two dimensionless parameters inherently has limited accuracy for all applications.
Considering the previous two frictional losses, hydraulic and disk, energy losses due to friction generally convert to heat, resulting in an increased temperature of the fluid. The increased fluid temperature affects the viscosity of the fluid, which also affects pump performance. This explains why pumps in systems with viscous fluids have different behaviors in a cold startup compared to a steady operation.
To account for the effects that a viscous fluid has on pump performance, an engineer can use general correction factors for head, volumetric flow rate and efficiency, shown in Equation 1. A dimensionless number called B helps predict the viscous component of each correction factor. The parameter B incorporates the effects of the Reynolds number and the specific speed of the pump, for frictional loss reasons discussed above. The parameter B also informs the range of applicability for the corrections. For example, when B is greater than 40, it will take further loss analysis to determine if the correction factors are still dependable.
Equation 1

An engineer can use the correction factors to adjust the pump performance curve from the values obtained using water to a predicted curve for how the pump will perform with the viscous fluid. The ANSI/HI 9.6.7-2015 method calculates the correction factors for volumetric flow rate (CQ) and efficiency (CE) and assumes these values to be constant at all analyzed flow rates for the pump and fluid of interest. For the head correction factor (CH), the method assumes the shutoff head for the pump is not dependent on the viscosity of the fluid and will be the same value for both water and the viscous fluid.
Additionally, the method assumes the flow and head correction factors, CQ and CH, are equal at the water best efficiency point (BEP). With those constraints in mind, the head correction factor is a function of the volumetric flow rate correction factor, CQ, and the ratio of water flow rate relative to the BEP flow rate, QW / QBEP-W.
Several researchers evaluated these correction factors in a variety of different settings to compare the predicted head and power for a pump with viscous fluid to actual test data of the viscous fluid in the pump. While there are deviations, actual and predicted values differ based on the flow rate and fluid viscosity, in most cases the tested values agreed with the predicted values.
Researchers attribute some of the deviation to uncertainty that comes from measurement instruments, which is difficult to quantify.
The ANSI/HI 9.6.7-2015 guideline is based on test data for the following pumps and fluids. Thus, the guideline is generally only applicable for systems that fall within these constraints.
single and multistage pumps
closed and open impellers
specific speeds from 310 to 2,330 U.S. units (6 to 45 metric)
kinematic viscosity from 1 to 3,000 centistokes (cSt)
impeller diameters from 5.5 to 16 inches (140 to 406 millimeter [mm])
water BEP flow from 32 to 1,230 gallons per minute (gpm) (7.2 to 280 cubic meters per hour [m3/hr])
water BEP head from 30 to 427 feet (9 to 130 meters)
water BEP efficiency from 28% to 86%
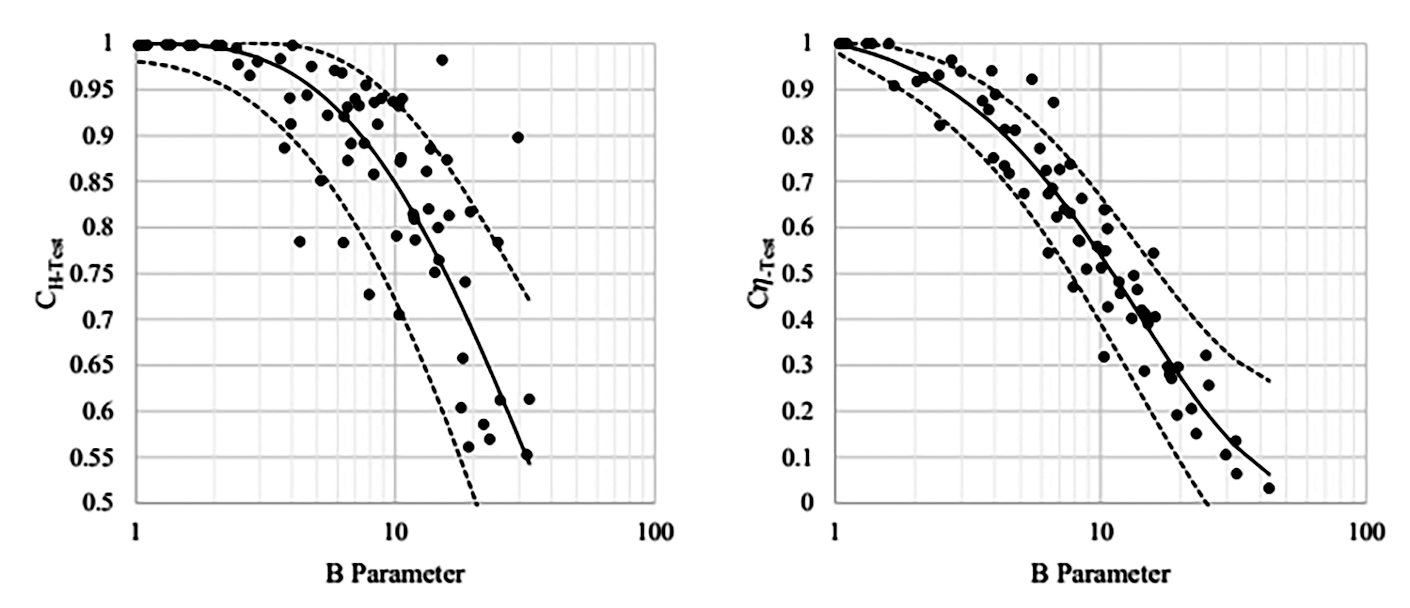
IMAGE 1: Test data (points) with 80% prediction intervals (dashed lines) (Images courtesy of Applied Flow Technology)
Graphing the test data from which the correction factors were based versus the B parameter, research shows that most of the test data points fall within an 80% prediction interval, as shown in Image 1. However, pumps with the same B parameter can have a range of different viscous performance points. Graphing independent experimental data supports the same general trend shown in Image 1.
In most pumping systems the ANSI/HI corrections will provide acceptably accurate predictions for viscous pump performance, especially as engineers include various safety factors and margins of error, as they often do. For situations that call for a more conservative estimation, an engineer can account for the standard deviations on the correction factors. Include the standard deviation by lowering the head correction factor by 0.1 and the efficiency factor by 0.15, which will result in a larger pump and motor.
The viscosity ANSI/HI guidelines are widely used. In fact, feedback indicates that using the corrections does not result in incorrectly sized pumps for most applications. Regardless, engineers designing systems with thicker fluids must understand the uncertainties and limitations of the corrections.

